
Welcome to Cornerstone
A cornerstone is the first stone set. Every other stone in the structure aligns to it — get it right and the wall stands straight for a century.
This newsletter is for people who lay their own stones: households running their own wealth across multiple custodians, entities, and tax years. Every issue delivers one wealth-building strategy explained properly, a few numbers that actually matter, and zero fluff.
One thing to be clear about up front: Cornerstone is education, not advice. We'll show you how the rules work and what questions to ask. What you do with that — and what you confirm with your advisor, CPA, or estate attorney — is yours.
Let's lay the first stone.
What your portfolio actually costs
Ask a seven-figure household what their portfolio returned last year and you'll usually get a number. Ask what it cost last year and you'll usually get a pause.
That's not carelessness — it's design. Portfolio costs don't arrive as an invoice. Management fees debit quietly from an account nobody reads line by line. Fund expenses are deducted inside each fund's price before you ever see it. Cash earns whatever it earns. Tax drag shows up fifteen months later on a 1099, disconnected from the decisions that caused it.
This issue isn't an opinion about any of those costs. It's a method: five lines, findable in an afternoon, that add up to the one number every owner should know — your all-in cost.
Line 1 — Management and advisory fees. If you work with an advisor or use a managed product, the fee is in your fee schedule (or the firm's Form ADV Part 2) and debits quarterly. Compute: annual dollars ÷ portfolio value. This line is also where the most value can sit — planning, tax coordination, behavioral discipline through bad markets are real services. The method doesn't presume the answer; it prices the question.
Line 2 — Fund expenses (your weighted expense ratio). Never on any statement — expense ratios come out of each fund's price. Compute: each holding's expense ratio × its share of the portfolio, summed. Across a multi-custodian household this is the line most people have genuinely never seen.
Line 3 — Cash drag. Idle cash earning below market yield is a cost, even though nothing is billed. Compute: (market money-market yield − your actual yield) × average cash balance. Sweep accounts are where this hides.
Line 4 — Trading friction. Commissions, bid-ask spreads, and (in managed wrappers) embedded trading costs. Small for most buy-and-hold households; meaningful with high turnover or thinly traded holdings. A fair estimate beats a false zero.
Line 5 — Tax drag. The tax you pay on investment income you didn't ask for: fund capital-gain distributions, non-qualified dividends and interest sitting in taxable accounts. Last year's 1099-DIV is the source document. Compute: tax attributable to distributions ÷ portfolio value.
Add the five lines. That's your all-in number. One useful nuance while you're there: fees billed to your accounts (line 1) are paid with after-tax dollars — the deduction for them ended in 2018 and the 2025 tax law made that permanent — while fund expenses (line 2) net against returns inside the fund. Knowing which is which matters when you compare options.
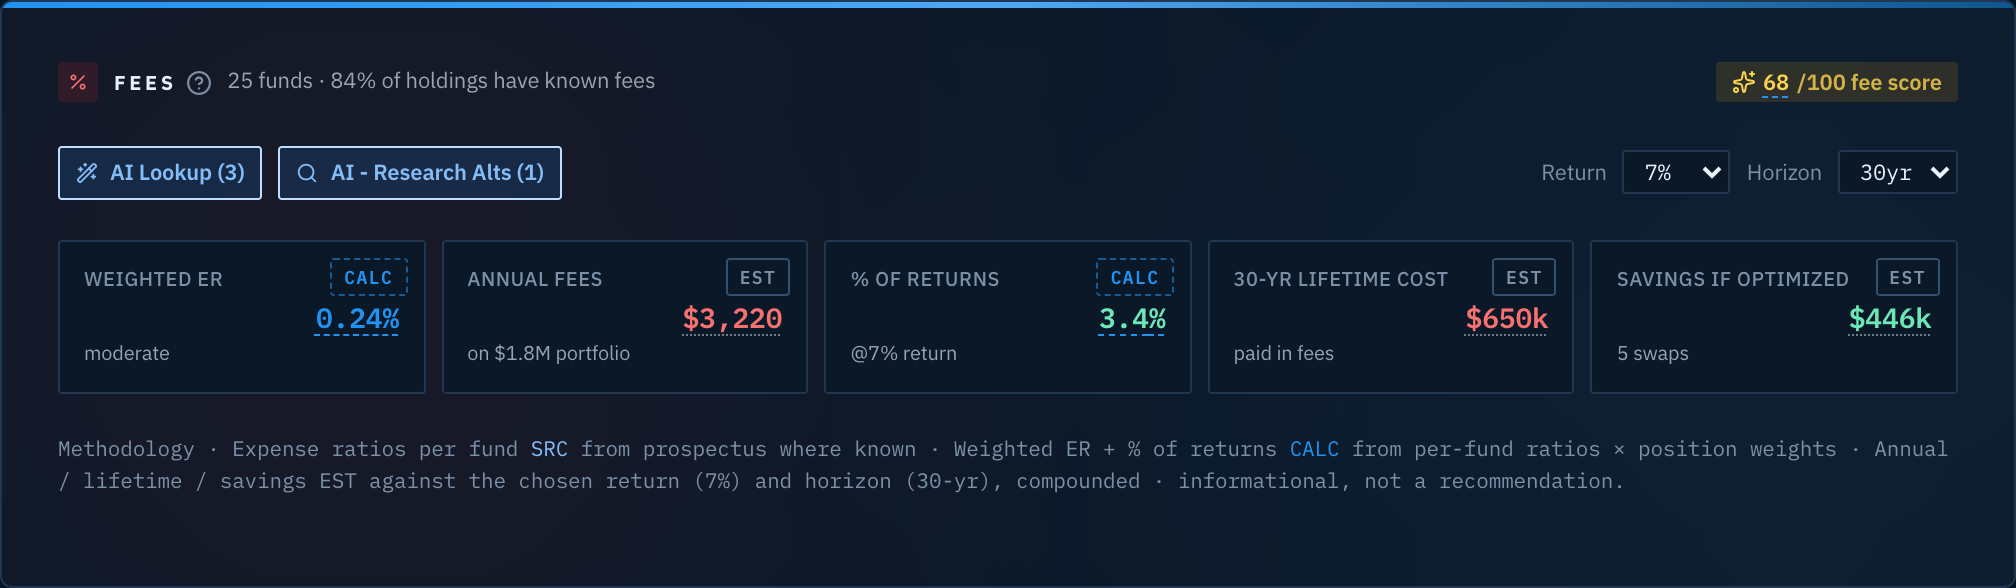
Formation's fee analyzer on our sample household: weighted expense ratio, annual fees in dollars, share of returns consumed, 30-year lifetime cost, and the savings available from lower-cost equivalents. Every figure is badged by provenance: sourced, calculated, or estimated.
Run the numbers — what a half-percent is worth
Why bother with the audit? Because small percentages on large portfolios compound into house-sized numbers. On a $2,500,000 portfolio earning 7% before costs, over 20 years with no flows:
All-in cost | Cost this year | Value after 20 years |
|---|---|---|
0.25% | $6,250 | $9,232,000 |
0.75% | $18,750 | $8,405,000 |
1.25% | $31,250 | $7,648,000 |
Each 0.50% step is roughly $800,000 over the period. The table is deliberately unlabeled — no "advisor tier" or "DIY tier." Households arrive at every one of these numbers by many different routes. What matters is knowing which row you're in, and why.
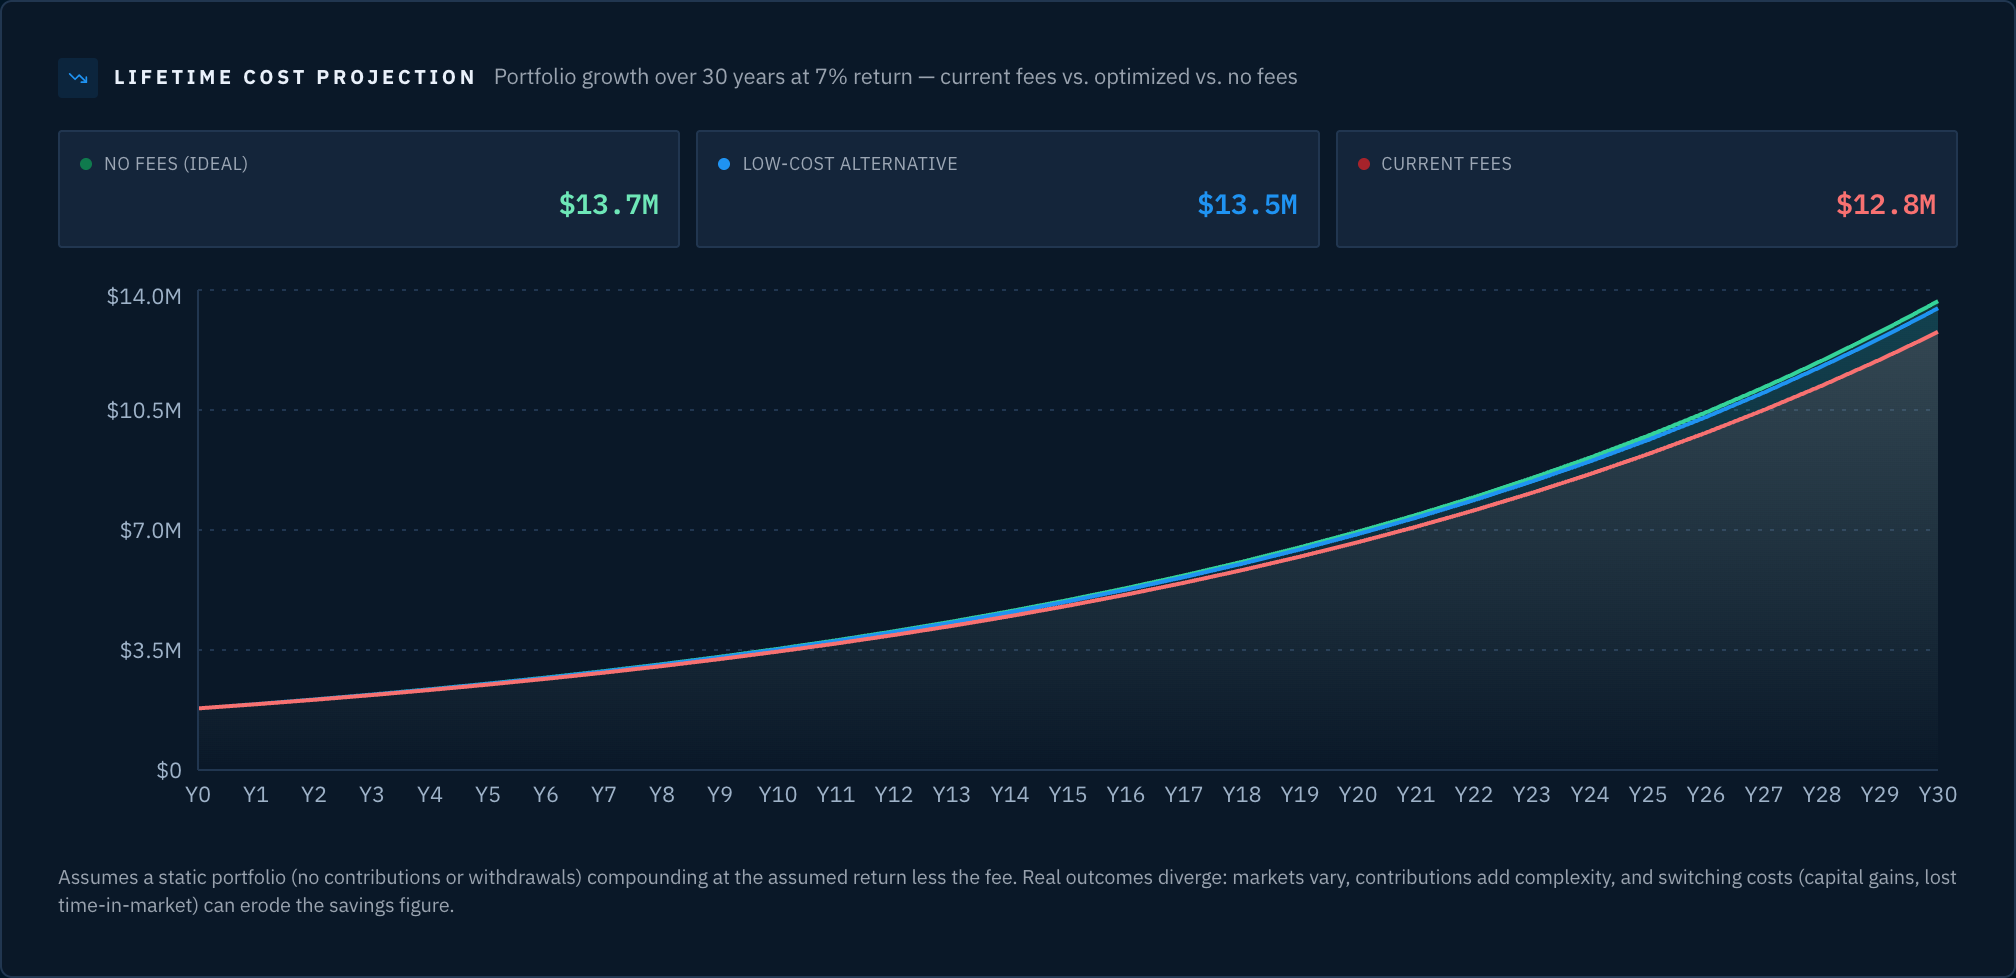
Formation's lifetime cost projection for the sample household: current fees vs. a low-cost alternative vs. the no-fee ideal, compounded over 30 years.
Methodology · CALC from the stated inputs · EST against a fixed 7% gross return, no flows, constant cost rates · this is an illustration, not a Formation forecast or recommendation.
What to do with the number
The all-in number is not a verdict — it's the start of a value question: what is each line buying, and could I get the same thing for less? A fee that buys tax coordination that saves more than it costs is cheap. The same fee for something you'd automate anyway is expensive. An active fund can earn its expense ratio; one that closely tracks its benchmark while charging 10–20× an index fund's fee usually can't. You can only make these judgments about costs you can see.
Two levers raise the after-tax side of the ledger without changing your costs or your holdings:
Asset location. Interest and non-qualified dividends are taxed as ordinary income — up to 40.8% at the top, including the 3.8% net investment income tax — while qualified dividends and long-term gains top out at 23.8%. Placing ordinary-income generators in tax-advantaged accounts and low-turnover equity in taxable, where your account mix allows, raises after-tax return with the same portfolio. Model before moving.
Loss harvesting, year-round. Realized losses offset gains realized any time in the same tax year, plus $3,000 of ordinary income. Most households only look in December. There's enough here for its own issue — coming soon.
None of this is personalized advice — bracket, state, and account mix change every answer. All of it is arithmetic you're allowed to see.
From the workshop
Formation's dashboard computes most of the five lines for you, across every account and custodian — that's what the screenshots above are: the fee analyzer in Investments → Income & Fees, with your weighted expense ratio calculated live (math shown, not just the result), annual and lifetime fee drag, and lower-cost comparisons. Alongside it: idle-cash and yield flags for line 3, the tax-efficiency and asset-location views for line 5, the cross-custodian tax-loss scan, and AURA, Formation's proprietary AI, explaining any figure with citations back to the source data.
Founding members lock in $17.99/month (or $199/year) for as long as they stay subscribed.
Cornerstone grows by referral, not by ad spend. If this issue was useful, forward it to one person who runs their own money — that's the whole growth plan.
And if you're a Formation member: your personal invite link is on your Profile. When someone you refer becomes a paying member, you both get a $14 credit toward your subscription.
— Brad
Founder, Formation
Cornerstone is published by Formation Money. It's educational content — not investment, tax, or legal advice, and not a recommendation to buy or sell any security. Formation Money is not a registered investment adviser and does not provide personalized financial advice; AURA provides education only. Consult your CPA, attorney, or adviser about your own situation.